How rainy is Dublin?
‘Everybody talks about the weather, but nobody does anything about it’ Mark Twain
Cities worldwide are promoting walking and cycling to reduce congestion and carbon emissions and to improve public health through increased physical activity. When it comes to cycling, poor weather is frequently cited as a major reason for not cycling, among both non-cyclists and car commuters. Here, Lorenzo Battistin, a Dublin Cycling Campaign volunteer, compares (1) Dublin rainfall data from Met Eireann with (2) Dublin car commuters’ perception of how often you would get wet if cycling to work or college.
For rainfall, Met Eireann hourly data from Dublin Airport going back to the 1940’s was used. Dublin City Council survey data was used for the perception of how often you would get wet if cycling.
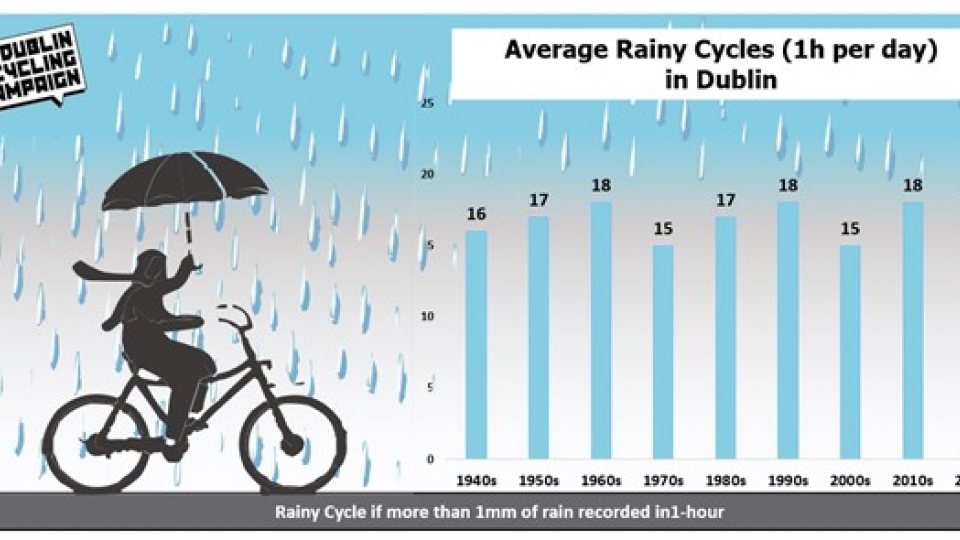
Figure 1 above shows rainy days per year for cycle commuters (1 hr cycle). We found that a cyclist would get wet on average 17 days per year if cycling 1 hour per day in Dublin. We only considered rainfall of >1mm/hour (significant rain).
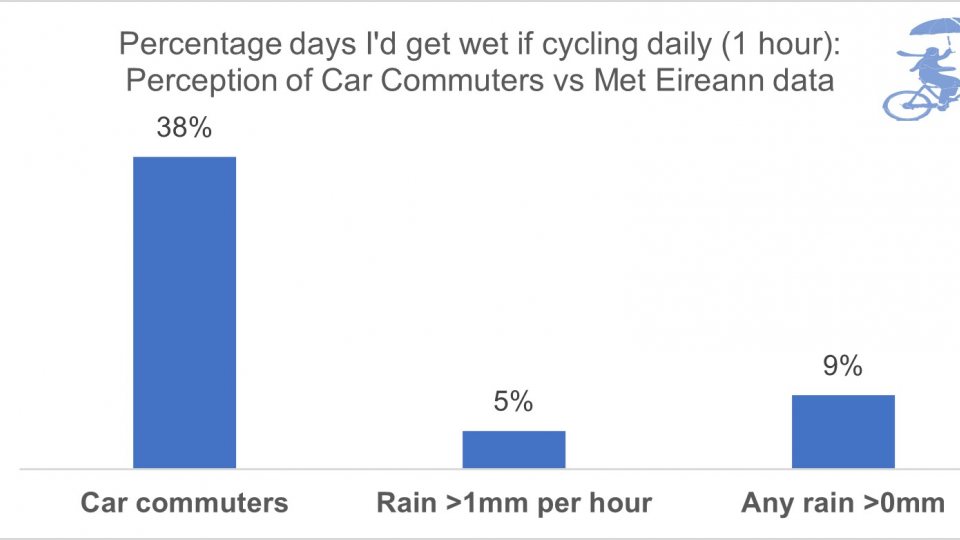
Figure 2 shows rainy days per year: Actual vs perception from car commuters. (% days per year). This is roughly 5% of the time, considering rain >1mm/hr, or 9% of the time if we consider any rain (>0mm/hr). However, car commuters perceived that they would get wet 38% of the time.
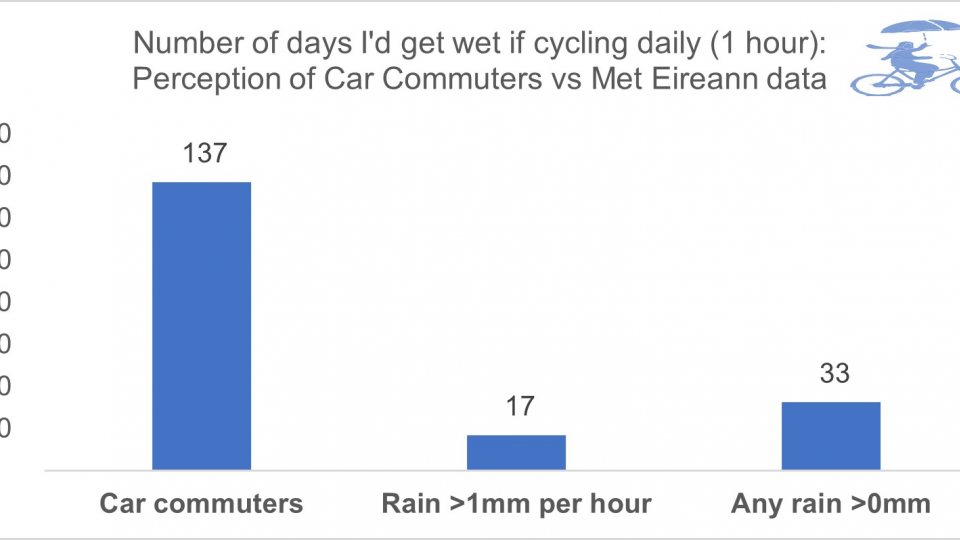
Figure 3 shows rainy days per year: Actual vs perception from car commuters. (# days per year). Translating this to a number of days per year, we see the actual number of days you’d get wet is between 17 and 33 (assuming you cycled for an hour each day). Car commuters perceive that they’d get wet 137 days per year.
Conclusion: Our wet March might make this hard to believe, but taking a longer timeframe (80+ years) the average number of days you’d get wet if cycling (>1mm per hour) is fairly consistent at 15 to 19 days per year. With the push for more active travel, this misperception of how often it rains on commutes may need to be addressed to encourage more people to leave the car at home and cycle to work or college.
Notes:
Considered only rainfall greater than 1mm per hour as anything less is very light rain.
Looked at rain for a 1 hour period (8 & 9 AM). Average commuting time was 22 mins from City Council survey. 1 hour is therefore considered to cover morning plus evening commute by bike.
Rainfall data is over a 365 day period.
Rainfall data from Met Eireann station in Dublin Airport was used.
Data Sources
Available Data - Met Éireann - The Irish Meteorological Service
Weather and Cycling in Dublin : Perceptions and Reality - Author : Keegan, O P 1 .
END
Appendix (additional findings from study):
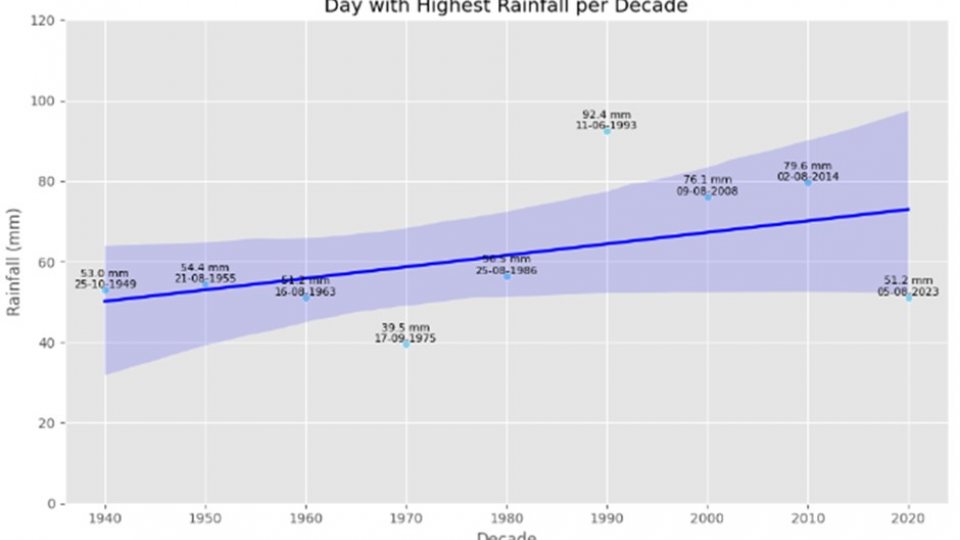
- Day with the Highest Rainfall by Decade in Dublin. We know rising temperatures can lead to an increase of flooding risk caused by extreme rainfall (European Commission, 2023). It was established in previous subchapters that temperature is increasing in Dublin since the 1940’s, hence we could expect to see maximum rainfall recorded in a day by decade to increase over time. Fig 4 below shows exactly this. Of the 8 full decades analysed, the 3 highest rainfall days were all recorded in the decades since 1990., It’s the highest rainfall days (the peaks) not the average daily rainfall, that creates flood risk. 6 out of the 9 observations plotted in Chart 6 took place in August, indicating that flooding risk is particularly high in that month: the government might want to pro-actively plan for such risk.
Figure 4. Day with the highest Rainfall in mm recorded by Decade in Dublin.
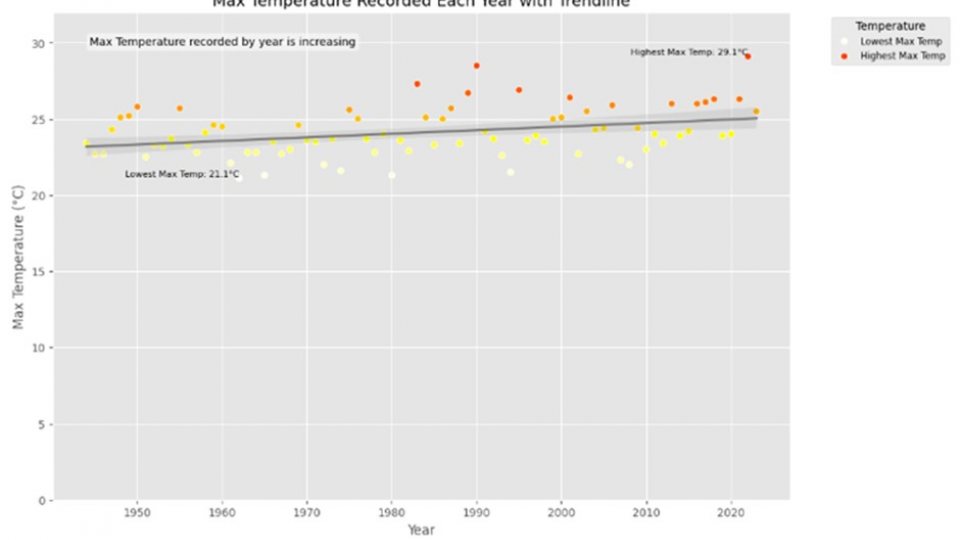
- Max and Min Temperature recorded by decade between 1944-2023 in Dublin. This graph shows most of the hottest days over past 80 years have occurred since 1980. In addition, the trendline shows the temperature of the hottest day per year is increasing.
Figure 5. Max and Min Temperature recorded each year between 1944-2023.
Help us do more for cycling in Dublin by becoming a member!